line
Photo by Charles Deluvio on Unsplash
### What Is Linear Regression?
Linear regression is a linear approach to determine the relationship between a two data points, one independent and one dependent variable. Linear models are simple and often provide a sufficient amount of detail about how the inputs affects the output. For prediction purposes they can sometimes outperform fancier nonlinear models, especially in situations with small numbers of training cases or data that is spread out about the average.
### Importing Libraries
```python
#importing libraries
import pandas as pd
import matplotlib.pyplot as plt
from sklearn.linear_model import LinearRegression
```
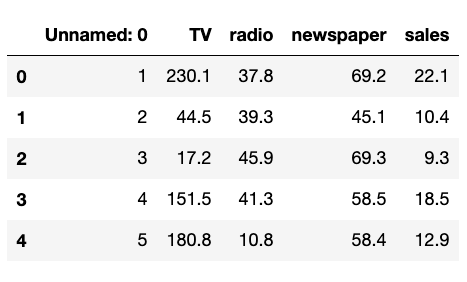
### Read the dataset
```python
df = pd.read_csv("data.csv")
df.head()
```
### Implementing Linear Regression Model
Y = mX + b
We will use this equation to train our model with the given dataset and predict the value of Y for any given value of X. We first will have to determine the slope and intercept values. Scikit-learn allows us to get easily create a linear regression model and determine those values by doing the following:
```python
#separating the input features and output from dataset
X_data = df.TV.values.reshape(-1,1)
Y_data = df.sales
#fitting the model
model = LinearRegression().fit(X_data, Y_data)
#getting the coefficient and slope values
slope = model.coef_
intercept = model.intercept_
print("Coefficient =",slope,"\nSlope =",intercept)
```
```
Coefficient = [0.04753664]
Slope = 7.032593549127695
```
### Plotting
```python
#linear relationship
Y_pred = slope*X_data + intercept
#plotting the actual values
plt.scatter(X_data,Y_data, color="blue")
#plotting predicted values
plt.plot(X_data,Y_pred, color="red")
#set labels for axes
plt.xlabel('TV')
plt.ylabel('Sales')
```
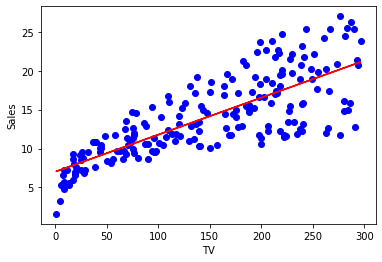
Linear regression can be used to make simple predictions. It won't be best for every dataset because it assumes that the inputs are linear, but it can give you an insight on the data you are handling.
Linear Regression Using Scikit-Learn Library
Linear Regression is the simplest and the first machine learning algorithm one would study. In this post, I further explain what linear regression is and will demonstrate how to implement a model in Python using the Scikit-learn library.

